

Edition May 20th - 21st, 2022
NOI Hackathon Open Data Hub Edition
Orange Juice
Winner of the Open Data Hub challenge
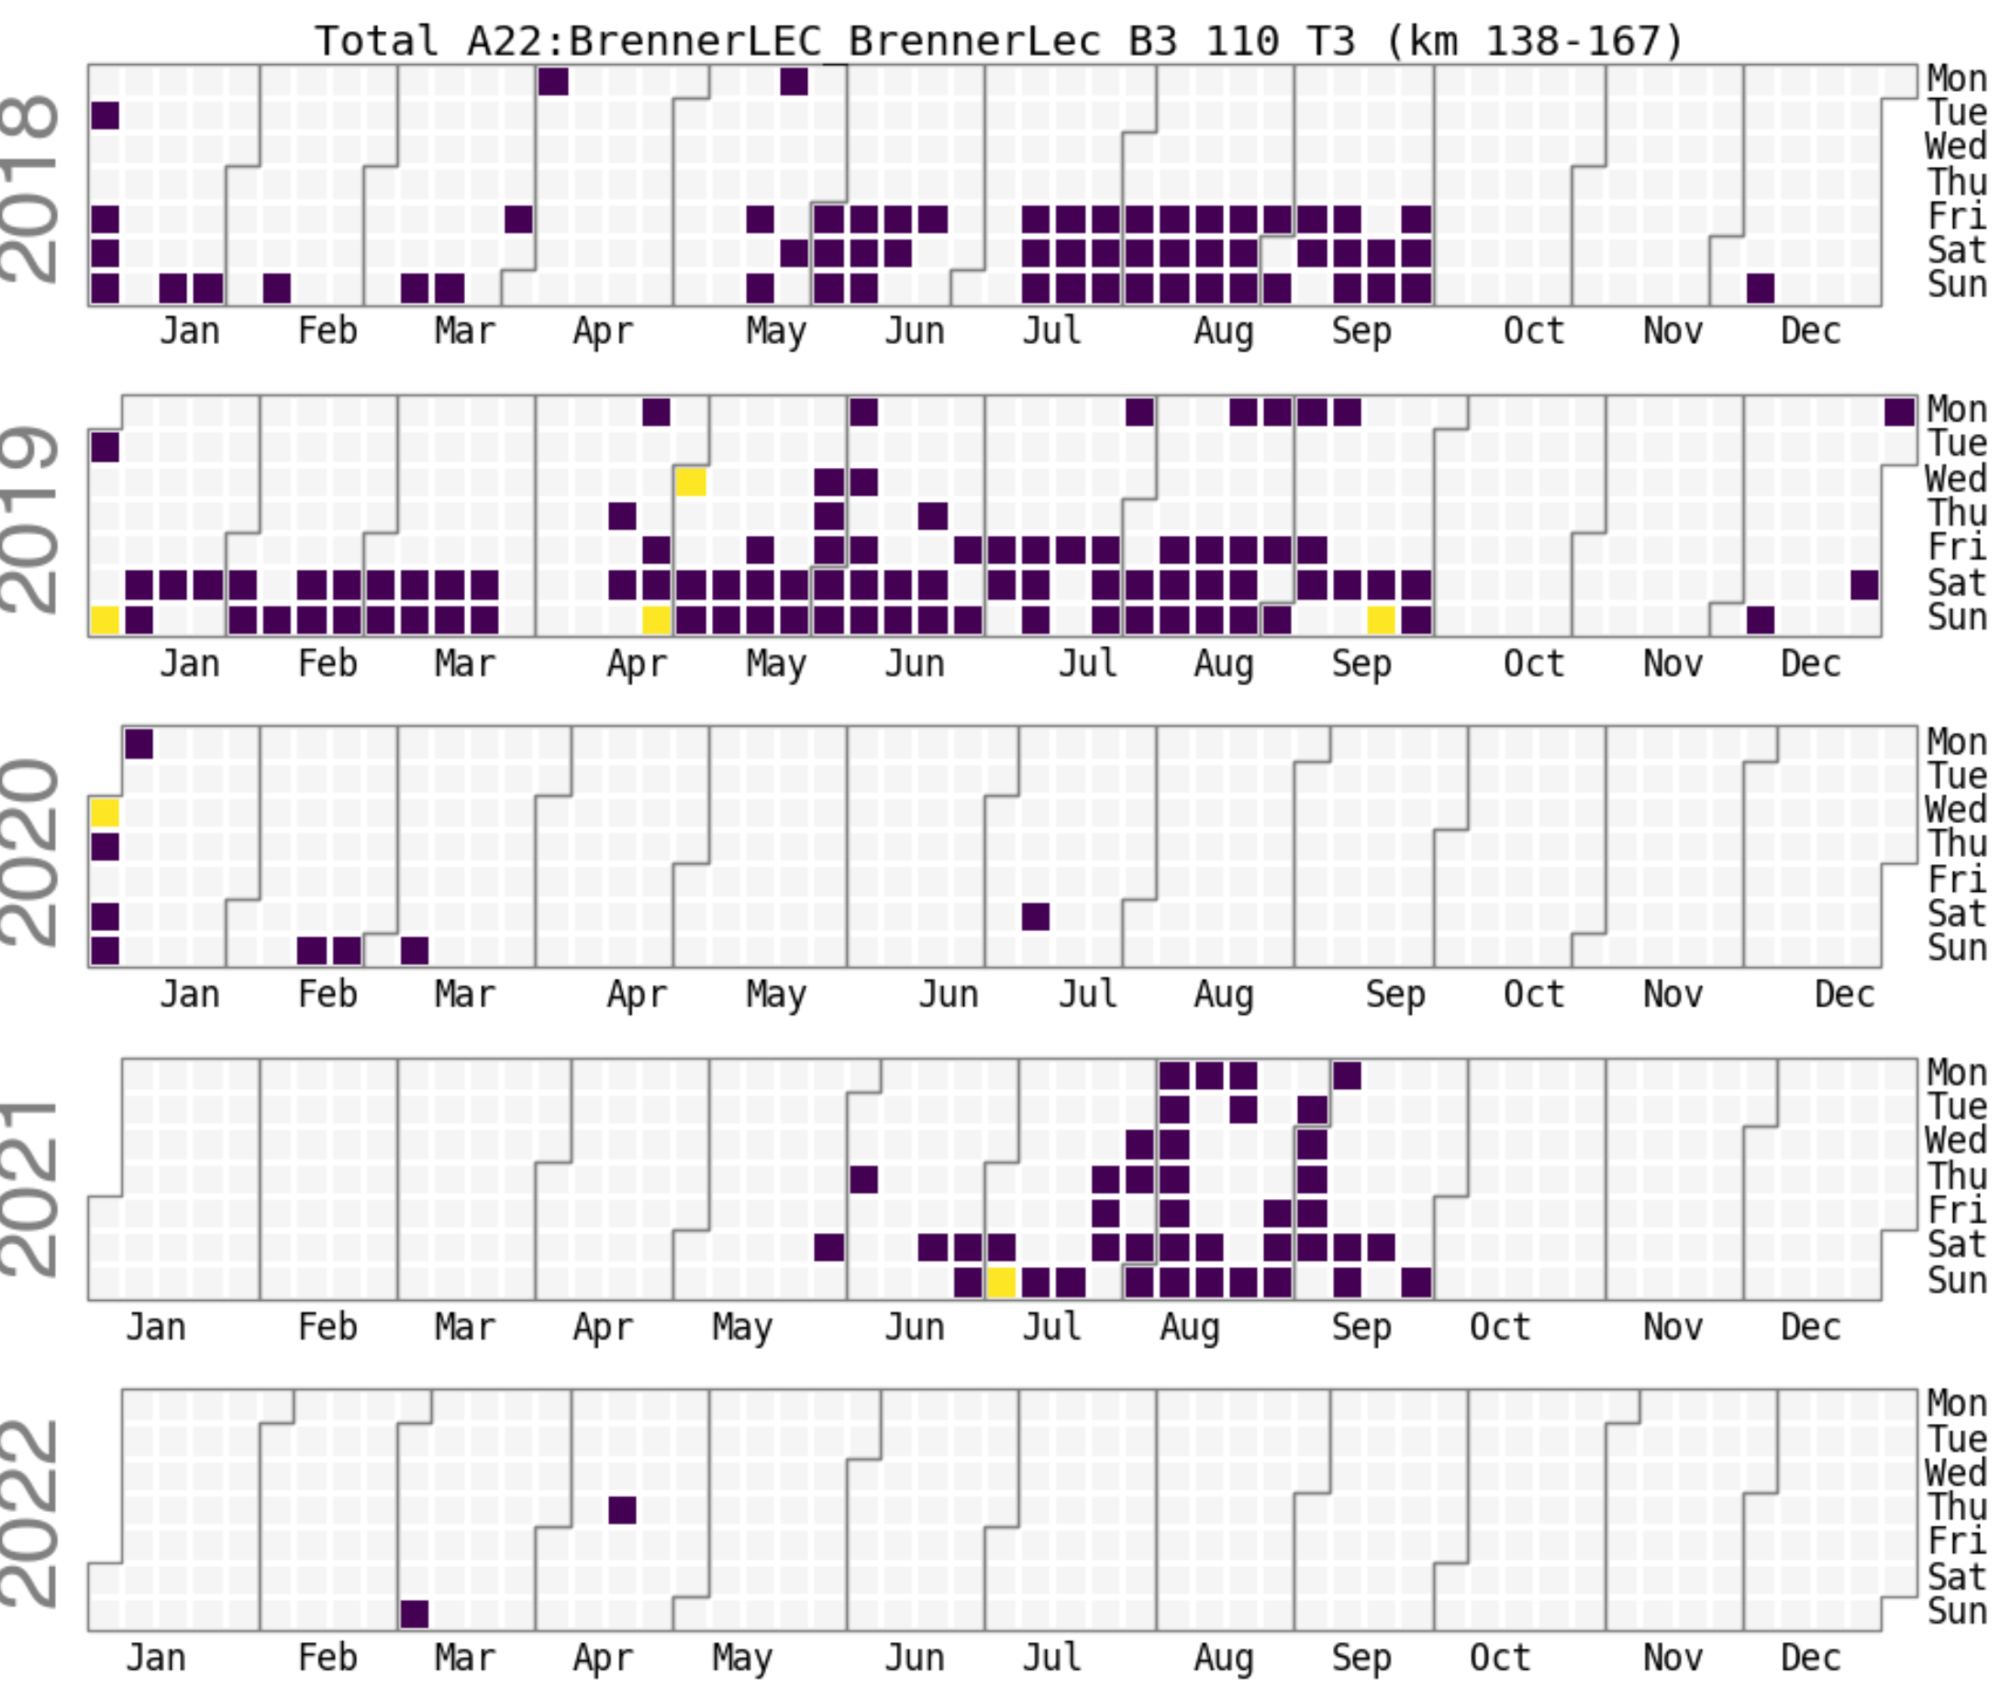
With the development of new technologies, it becomes easier to visualize data which is coming from sensors (such as time-series data, for example, from the parking slots of Bolzano, Italy).
In this project, we apply new visualization tools coming from the modern libraries such poorly, ipywidgets, july, calplot in order to build a better tool for providing information about different sensors located in the city. Those sensors are mostly located in the South Tyrol.
VIDEO: https://vimeo.com/712351599
